Stop and Classify the Irises
I wanted to analyze real scientific or economic/demographic data for my project this week. There is a lot of demographic data on the internet, particularly from .gov sites and the census, but it is difficult to sort through and often requires decoding. In some cases, it’s impossible to find the raw data to work from.
My exhaustive Google search turned up UCI’s Machine Learning Repository (how convenient!), where I came across this dataset of iris species measurements. The three species the data was taken from are very similar, and are most easily distinguished by measuring petal lengths and widths. The data provided also includes sepal lengths and widths, but the petal measurements correlate better to species differentiation, so I only used those.
I made some tweaks to the PSVM example from class in order to use this data. The data I used had very small values, since they are measurements in centimeters, so I only had to map the data to the range (0,1) without changing the order of magnitude. I also thought it would be clever to change the data colors to match those of an iris flower.
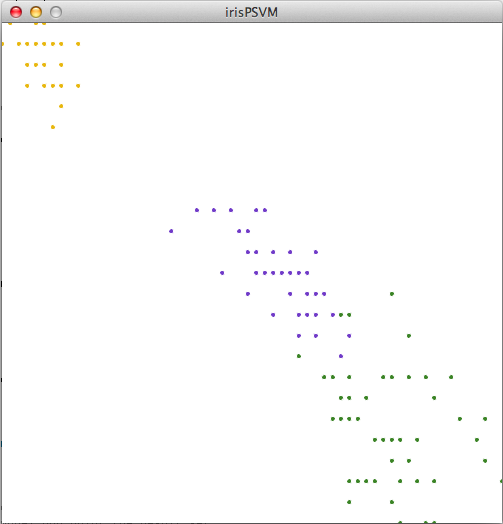
Data points:
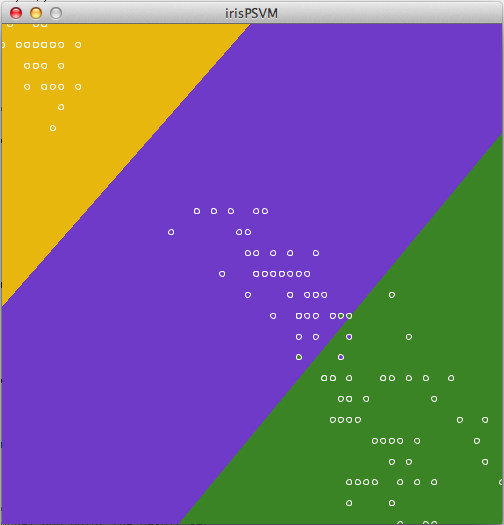
Classified data ranges:
My code is below. Code with datasets on Github.
1 2 3 4 5 6 7 8 9 10 11 12 13 14 15 16 17 18 19 20 21 22 23 24 25 26 27 28 29 30 31 32 33 34 35 36 37 38 39 40 41 42 43 44 45 46 47 48 49 50 51 52 53 54 55 56 57 58 59 60 61 62 63 64 65 66 67 68 69 70 71 72 73 74 75 76 77 78 79 80 81 82 83 84 85 86 87 88 89 90 91 92 93 94 95 96 97 98 99 100 101 102 103 104 105 106 107 108 109 110 111 112 113 114 115 116 117 118 119 120 121 122 123 124 125 126 127 128 129 130 131 132 133 134 135 136 137 138 139 140 141 142 | //Kim Ash //Makematics - Fall 2012 //irisPSVM - uses SVM to classify iris varieties based on petal length and width data //data source: http://archive.ics.uci.edu/ml/datasets/Iris import psvm.*; SVM model; float[][] trainingPoints; int[] labels; Table data; PGraphics modelDisplay; boolean showModel = false; void setup(){ size(500,500); // displaying the model is very slow, so we'll // do it in a PGraphics so we only have to do it once modelDisplay = createGraphics(500,500); // load the data from the csv data = new Table(this, "irisPetal2.csv"); // we'll have one training point for each line in our csv // each training point will have two entries (x and y) trainingPoints = new float[data.getRowCount()][2]; // we need one label for each training point indicating // what set the point is in (1, 2, or 3) labels = new int[data.getRowCount()]; // loop through the CSV rows // to create the trainingPoints and labels int i = 0; for (TableRow row : data) { float[] p = new float[2]; // scale the data from 0-1 based on the // range of the data p[0] = map(row.getFloat(0), 1, 6.9, 0, 1); //map petal length data p[1] = map(row.getFloat(1), 0.1, 2.5, 0, 1); //map petal width data trainingPoints[i] = p; labels[i] = row.getInt(2); i++; } // initialize our model and problem objects model = new SVM(this); SVMProblem problem = new SVMProblem(); // we need one feature for each axis of the data // so in this case x and y means 2 features problem.setNumFeatures(2); // load the problem with the labels and training data problem.setSampleData(labels, trainingPoints); // train the model model.train(problem); drawModel(); } // this function colors in each pixel of the sketch // based on what result the model predicts for that x-y value // it saves the results in a PGraphics object // so that it can be displayed everytime beneath the data void drawModel(){ // start drawing into the PGraphics instead of the sketch modelDisplay.beginDraw(); // for each row for(int x = 0; x < width; x++){ // and each column for(int y = 0; y < height; y++){ // make a 2-element array with the x and y values double[] testPoint = new double[2]; testPoint[0] = (double)x/width; testPoint[1] = (double)y/height; // pass it to the model for testing double d = model.test(testPoint); // based on the result, draw a yellow, purple, or green dot (iris colors) if((int)d == 1){ modelDisplay.stroke(232, 183, 14); //iris yellow } else if ((int)d == 2){ modelDisplay.stroke(112, 58, 200); //iris purple } else if ((int)d == 3){ modelDisplay.stroke(58, 131, 37); //iris green } // which will fill up the entire area of the sketch modelDisplay.point(x,y); } } // we're done with the PGraphics modelDisplay.endDraw(); } void draw(){ // show our model background if we want if(showModel){ image(modelDisplay, 0, 0); } else { background(255); } stroke(255); // show all of the training points // in the right color based on their labels for(int i = 0; i < trainingPoints.length; i++){ if(labels[i] == 1){ fill(232, 183, 14); } else if(labels[i] == 2){ fill(112, 58, 200); } else if(labels[i] == 3){ fill(58, 131, 37); } ellipse(trainingPoints[i][0] * 500, trainingPoints[i][1]* 500, 5, 5); } } void keyPressed(){ if(key == ' '){ showModel = !showModel; } if(key == 's'){ model.saveModel("model.txt"); } } // on mouse click, for any given point // test it against the model and print the result set void mousePressed(){ double[] p = new double[2]; p[0] = (double)mouseX/width; p[1] = (double)mouseY/height; println((int)model.test(p)); } |